| Overall | 15W 5L 0T |
| District | 4W 0L 0T |
| Expected | 17: 0+ 3- |
":" = Games won or lost as expected,
"+" = Games won against stronger team,
"-" = Games lost against weaker team)
|
34 6 1 Rank in State, Class, District |
1024 208 Strength Momentum |
799 48.7(35) SOS, RPI(RPI Rank) |
":" = Games won or lost as expected, "+" = Games won against stronger team, "-" = Games lost against weaker team) | |
| Date | Opponent1 | RGWF4 | Opp Strength | Result | Expectation2 | Playing Strength | P(Win)3 | Send |
|---|---|---|---|---|---|---|---|---|
| 08/18/15 | Socorro | 0.000 | 1287 | L 0- 9 | Expected (-7) | 675 | 22% |  |
| 08/22/15 | ATC | 0.001 | 393 | W 6- 0 | Expected (-1) | 996 | 99% | |
| 08/25/15 | at Monte del Sol ?? | 0.003 | 698 | L 1- 2 | Worse (-4) | 827 | 85% | |
| 08/28/15 | at Silver | 0.006 | 895 | W 1- 0 | Expected (0) | 1025 | 63% | |
| 08/29/15 | at Bernalillo | 0.007 | 836 | W 1- 0 | Expected (-1) | 996 | 71% | |
| 08/29/15 | at Taos | 0.007 | 952 | L 1- 2 | Worse (-1) | 954 | 56% | |
| 09/01/15 | Sandia Prep | 0.007 | 1186 | L 1- 5 | Expected (-3) | 888 | 33% | |
| 09/05/15 | at Santa Fe Prep | 0.014 | 654 | W 4- 0 | Expected (+1) | 1056 | 89% | |
| 09/10/15 | Gallup | 0.031 | 642 | W 6- 1 | Expected (+1) | 1069 | 93% | |
| 09/15/15 | Robertson | 0.091 | 717 | W 2- 1 | Expected (-2) | 904 | 88% | |
| 09/17/15 | at Hatch | 0.072 | 782 | W 4- 0 | Expected (+2) | 1120 | 77% | |
| 09/24/15 | Ruidoso !! | 0.188 | 827 | W 5- 1 | Expected (+2) | 1110 | 79% | |
| 09/26/15 | at Robertson ? | 0.291 | 717 | L 0- 1 | Worse (-4) | 836 | 83% | |
| 09/29/15 | Hatch ! | 0.243 | 782 | W 5- 0 | Expected (+2) | 1139 | 83% | |
| 10/06/15 | Bernalillo | 0.576 | 836 | W 2- 0 | Expected (0) | 1014 | 78% | |
| 10/09/15 | at Portales | 0.602 | 799 | W 3- 1 | Expected (0) | 1028 | 75% | |
| 10/13/15 | Bloomfield | 0.536 | 761 | W 5- 0 | Expected (+2) | 1129 | 85% | |
| 10/19/15 | Ruidoso | 0.846 | 827 | W 3- 0 | Expected (+1) | 1060 | 79% | |
| 10/21/15 | Rehoboth Christian | 0.944 | 802 | W 2- 0 | Expected (-1) | 997 | 81% | |
| 10/24/15 | Portales | 0.958 | 799 | W 2- 0 | Expected (-1) | 996 | 81% | |
|
Notes: 1Games against an opponent in the same district are shown in bold letters; may NOT be an actual district game Numbers in parentheses for reported games are the goals East Mountain actually scored, relative to what ratings predicted 2Numbers listed for unreported/future games are the most probable winning margin 3P(Win) is the expected winning Percentage -- the statistical success rate for predicting the game winner between teams of this strength difference 4RGWF is the relative weight factor for this game * Game at a neutral site, or unable to determine which team gets home field advantage |
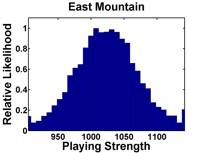
The median opponent strength is 799, while
East Mountain's "weighted playing strength" is 1027
(where a win by 4 goals counts 0.70 as much as a 1 goal win, and
a game played on 10/03/15 counts 0.5 that of one played on 10/24/15)
Go back to ratings for Boys Varsity Girls Varsity Main Page